Why data modernization needs quality and observability working together, at rest and in motion
What modernization actually solves
Companies modernize for good reasons. The legacy stack can no longer scale to what the business is asking of it. Separating storage from compute, combined with consumption pricing, is what makes spiky BI and AI workloads economically viable in the first place.
Migration doesn’t address whether the data is usable and trustworthy once it lands. Defects migrate. They arrive on the new platform faster, get distributed to more consumers through self-service, and increasingly get consumed by systems that can’t raise an eyebrow at a number that looks off. An analyst who has stared at the same report for four years notices when churn looks low. An agent acting on a retrieved value does not.
You need mechanisms that prevent quality issues, detect the ones that get through, and route them to someone who can act. In most estates, those functions live in different teams, in different tools, with substantial manual work holding them together. At modern data volumes, nothing manual survives contact with production.
At rest: knowing what you have
Data quality at rest is the evaluation of data after it lands in a storage system. It’s the half most organizations already have, usually built around scheduled rule execution against warehouse tables.
It starts before the rules, though, with terms assignment. A term is the governed unit of meaning in the glossary: it can represent a data domain, a business concept, a technical definition, a metric, a policy, or any other custom categorization. Assigning them means attaching those terms to catalog items or to individual attributes within them. You can do this manually, but at enterprise scale it runs through detection rules that scan metadata or the data itself and recognize that a column holds an email address, a national ID, or a payment reference.
This is also where critical data elements stop being a theoretical exercise. Not all data carries equal weight. A small fraction of it drives regulatory submissions, risk calculations, credit decisions, and customer-facing operations, and that fraction, your critical data elements, is what a quality program should be built around.
Terms and detection rules do double duty. They locate the critical attributes and make data discoverable, and because rules attach to terms, they make quality evaluation something you configure once rather than table by table.
Profiling analyzes both structure and content. It surfaces inconsistencies, missing values, duplicates, and outliers, and produces statistical patterns and format masks across attributes that show where defects actually concentrate. Profiling isn’t a preliminary step you complete and move past. It’s where rule conditions come from, and how you keep those rules up to date as the data underneath them changes.
Monitoring is the execution layer: rules running against persisted tables, files, and objects in warehouses, lakehouses, and databases, on a schedule or on demand.
While traditional data quality rules capture well-known, established business and technical data needs, anomaly detection raises red flags about potential problems, even without you expressing specific constraints in advance. Anomaly detection identifies unusual patterns: volume anomalies at the catalog item level, where the number of records departs from its established pattern, and distribution drift at the attribute level, where value distributions, standard deviations, or numeric sums shift. Capturing and assessing anomalies is also a great way to extend your curated data quality rules. That’s data observability at rest, and it exists precisely because you can’t enumerate every way data can go wrong.
In motion: stopping issues before they spread
Data quality in motion evaluates data as it moves, before it lands in a target table. That covers the path from source into the warehouse or lakehouse, and it covers promotions between medallion layers once the data is already inside.
The mechanism is the gate. The rules it runs are the same data quality rules that you already defined at rest. Nothing gets redefined for the pipeline; the same governed definition is simply executed at a different point in the data’s path. DQ Gates run rules inside the pipeline itself, on records passing through ingestion jobs, streams, ETL and ELT flows, and APIs, at the point of transformation rather than after the load. Each record or batch is validated against defined rules while it’s still in flight, and the result determines what happens next. Passing records continue to the target. Failing records can be gated, quarantined, or blocked outright, so bad data never reaches downstream consumers.
Alongside the rules, pipeline observability monitors structural integrity as data moves: failed jobs, late loads, missed SLAs, and schemas that changed without warning. Note what this catches that content rules don’t. The job that ran successfully and wrote nothing. The feed that showed up at a tenth of its usual size. The source that added a column overnight.
Why one half is never enough
The two halves aren’t alternatives; they feed each other in specific ways, and removing either one breaks the loop.
Profiling at rest authors the rules that run in motion. At-rest analysis tells you what the data looks like, which attributes carry business meaning, and where defects cluster. Those findings become rule conditions, deployed as at-rest monitoring and as pipeline gates. The gates then protect the estate that profiling monitors.
Rules cover known failure modes. Observability covers everything else. A data quality rule tests predefined, deterministic conditions, sometimes very complex ones, which means it can only fail in ways you anticipated. Anomaly detection and pipeline monitoring surface the ones you didn’t: the upstream system that silently changed a code list, the feed that shrank by 90%, the job that succeeded while writing nothing.
Catching a record in motion costs one intervention. Quarantining at the gate is a single action. Letting the record land means reprocessing every downstream table, model, and report that read it, and reconciling anything anyone did in the meantime. Gates keep target tables clean, which is cheaper than cleaning them.
At-rest checks produce a quantifiable trust signal. At-rest evaluation measures datasets and attributes against rules and dimensions and expresses the result as a score, either a DQ score or a composite Data Trust Index, so that both people and AI agents know what they’re allowed to act on. Just as importantly, it builds trend history.
The score at the target table shows whether your gates are working. The score at the target table is how you verify your gates are working. A clean target table with records clearing quarantine means the gate is doing its job. A falling score means defects are getting past it. A quarantine that only grows means the gate is catching what nobody is fixing, and the source system is still producing the same defect it produced last month.
| At rest | In motion | |
| Data quality | Profiling, datat quality rules, scoring, monitoring. Measures and scores data against defined rules over time | Data Quality Gates, running the same rules in the pipeline. Validates, gates, quarantines, or blocks invalid records before they land |
| Data observability | Volume anomalies, distribution drift. Catches changes no rule describes | Job failures, late loads, missed SLAs, schema drift. Catches delivery failures no rule sees |
| Together | Prevents reporting errors, regulatory missteps, and strategy set on untrustworthy data | Protects operational workflows, keeps bad data out of customer-facing systems, and reduces downstream rework |
Where the controls go
Follow the path the data takes. There are four placements, and most estates need all of them.
Source systems. Fix it where you can. Correcting a defect at origin stops it from reaching every downstream consumer at once. Profile the source, run rules against it, push issues back to the application owner.
Before ingestion, put checks in the pipeline between source and target, wired into the orchestration tooling you already run. This is also where pipeline observability covers the load itself, including failed jobs, late arrivals, and unexpected schema changes, so the warehouse starts clean rather than getting cleaned.
Between layers. Where a medallion pattern is in use, gate the bronze-to-silver promotion so that silver holds validated records by construction.
The warehouse or lakehouse. Monitor at rest regardless of what runs upstream. This is where consumption happens, where the scores your business users and AI agents act on get calculated, and where trend history accumulates. Upstream controls reduce what reaches it. They don’t remove the need to watch it.
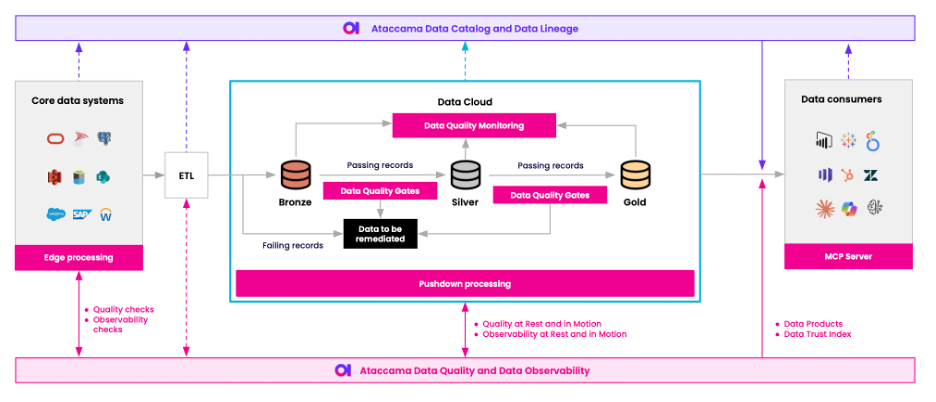
Needing all four is where the tooling problem starts. Teams commonly cover source systems with one product, pipelines with a second, and the warehouse with a third. The rules don’t match. The glossary doesn’t carry across. The score depends on which tool you ask. When quality failures, anomalies, and pipeline failures alert into three separate systems, data engineers end up triaging alerts with no business context. Alerting on thresholds, anomalies, and pipeline failures belongs in one queue, with escalation and ticketing attached, because remediation is where data quality programs stall.
How to put this into practice
You need to make 6 decisions before you start implementing the checks.
Scope. Which CDEs (Critical data elements), in which tables, in which sources. Start where a defect has a named business consequence.
What “good” means. Profile and classify first, then write rules against what profiling found. Keep the glossary and rule library governed and versioned so one definition applies everywhere it’s referenced. This isn’t a one-time exercise. Update your definition of “good” as you go: raise your standards as the data improves, and react to actual needs as consumers raise them.
Where the checks run, map your rules onto the four placements above and deploy them at those boundaries.
Who acts. Activate observability, set the monitors, create alert policies, and connect them to remediation workflows with named owners.
What happens on failure. Block, quarantine, or warn. Define criticality, set the action per issue type and affected asset.
What consumes the output. Data quality scores, Data Trust Index, and business metadata are outputs that show data has been assessed and enriched with information about its quality and reliability. Wire them into the systems that act on the data: a dashboard that shows the trust level of what it’s displaying, a pipeline that won’t refresh a model on data below threshold, an agent that can check whether a retrieved value is one it should act on.
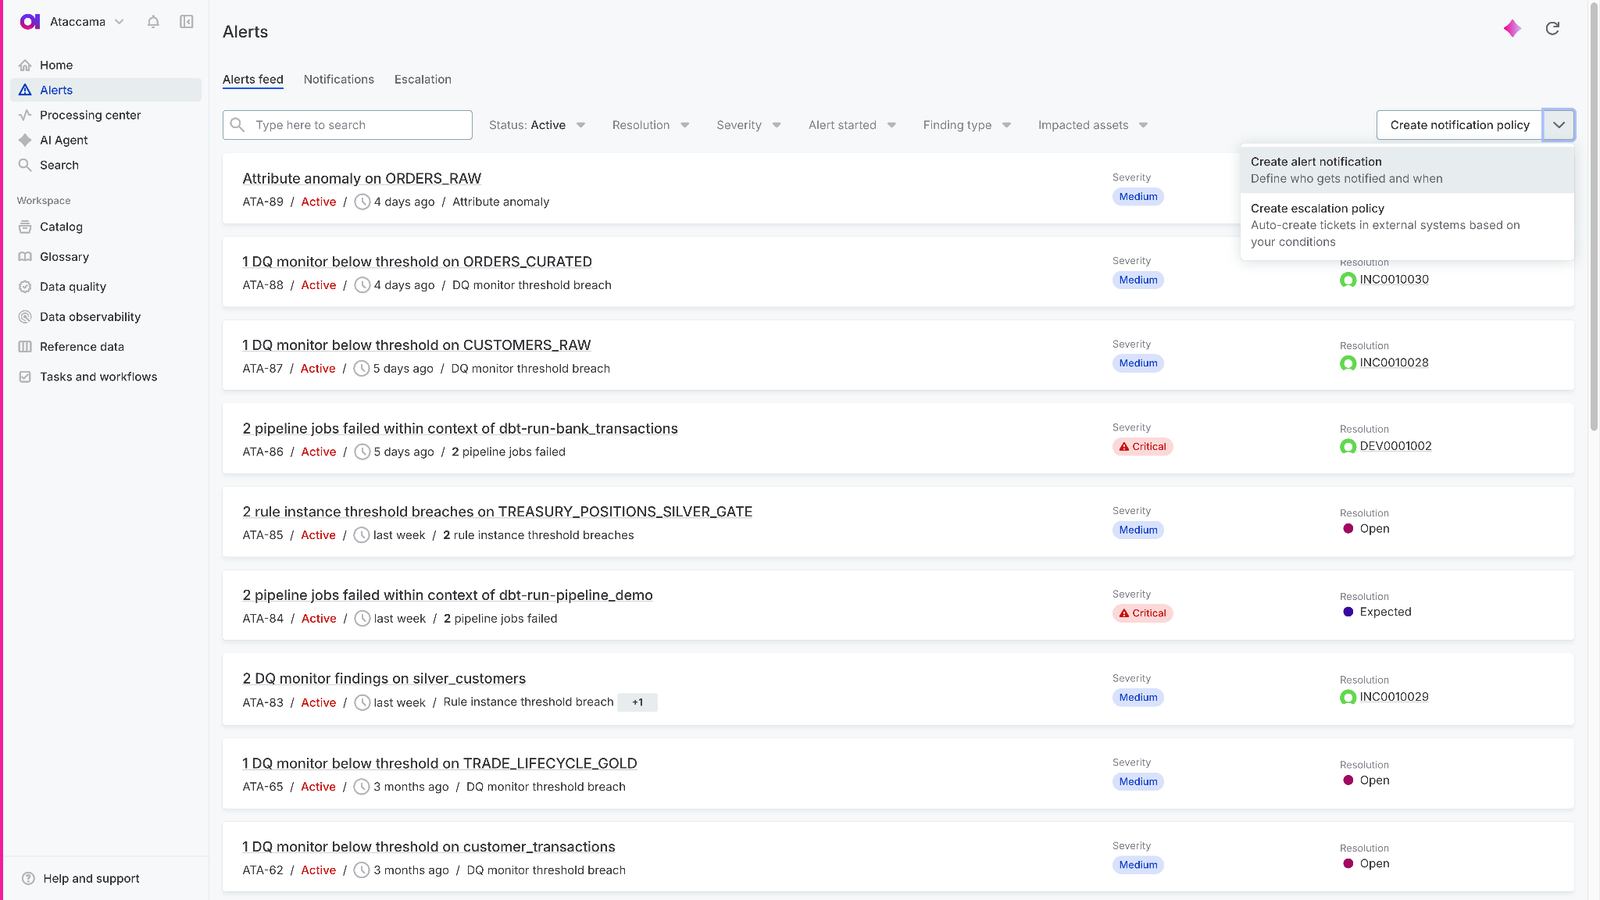
Platform consolidation lets quality and observability work together across the estate: one rule library, one score, and resolution workflows that carry lineage and business context. Ataccama runs cataloging, data quality, and observability on one platform, with stewardship and remediation attached, spanning source systems, pipelines, and the cloud warehouse. Add automated root-cause analysis and AI-powered remediation on top, and the estate keeps itself trustworthy as it grows. And because the trust signals travel with the data, exposed over MCP, the quality work reaches the systems that consume it.
Talk with our team about how quality and observability at rest and in motion can close gaps in your estate.
FAQ
Data quality at rest evaluates data after it lands in storage through profiling, scheduled rule execution, and scoring. Data quality in motion evaluates records while they are still moving through a pipeline, before they reach a target table, and acts on the result by letting them through, quarantining them, or blocking them.
Yes. At-rest scoring at the target table confirms that upstream gates are holding, and it’s the only mechanism that builds trend history showing whether quality is improving or degrading.
Data quality tests data against rules you defined, so it catches failure modes you anticipated. Data observability watches for patterns nobody wrote a rule for: volume anomalies, distribution drift, failed or late jobs, unexpected schema changes.
Rules are precise and deterministic. Observability is broader and less specific. Estates that run only one consistently get surprised by the category they left out.
Start with the critical data elements where a defect has a named business consequence, profile them at rest, and deploy the resulting rules as gates at the single boundary where the most consumers sit downstream.