How data observability simplifies the investigation of data quality issues
By the time low-quality data reaches downstream systems, it’s already costing you money and causing significant problems. That’s why data management systems need to be preventative instead of reactive, so you can fix broken data before it causes any actual harm.
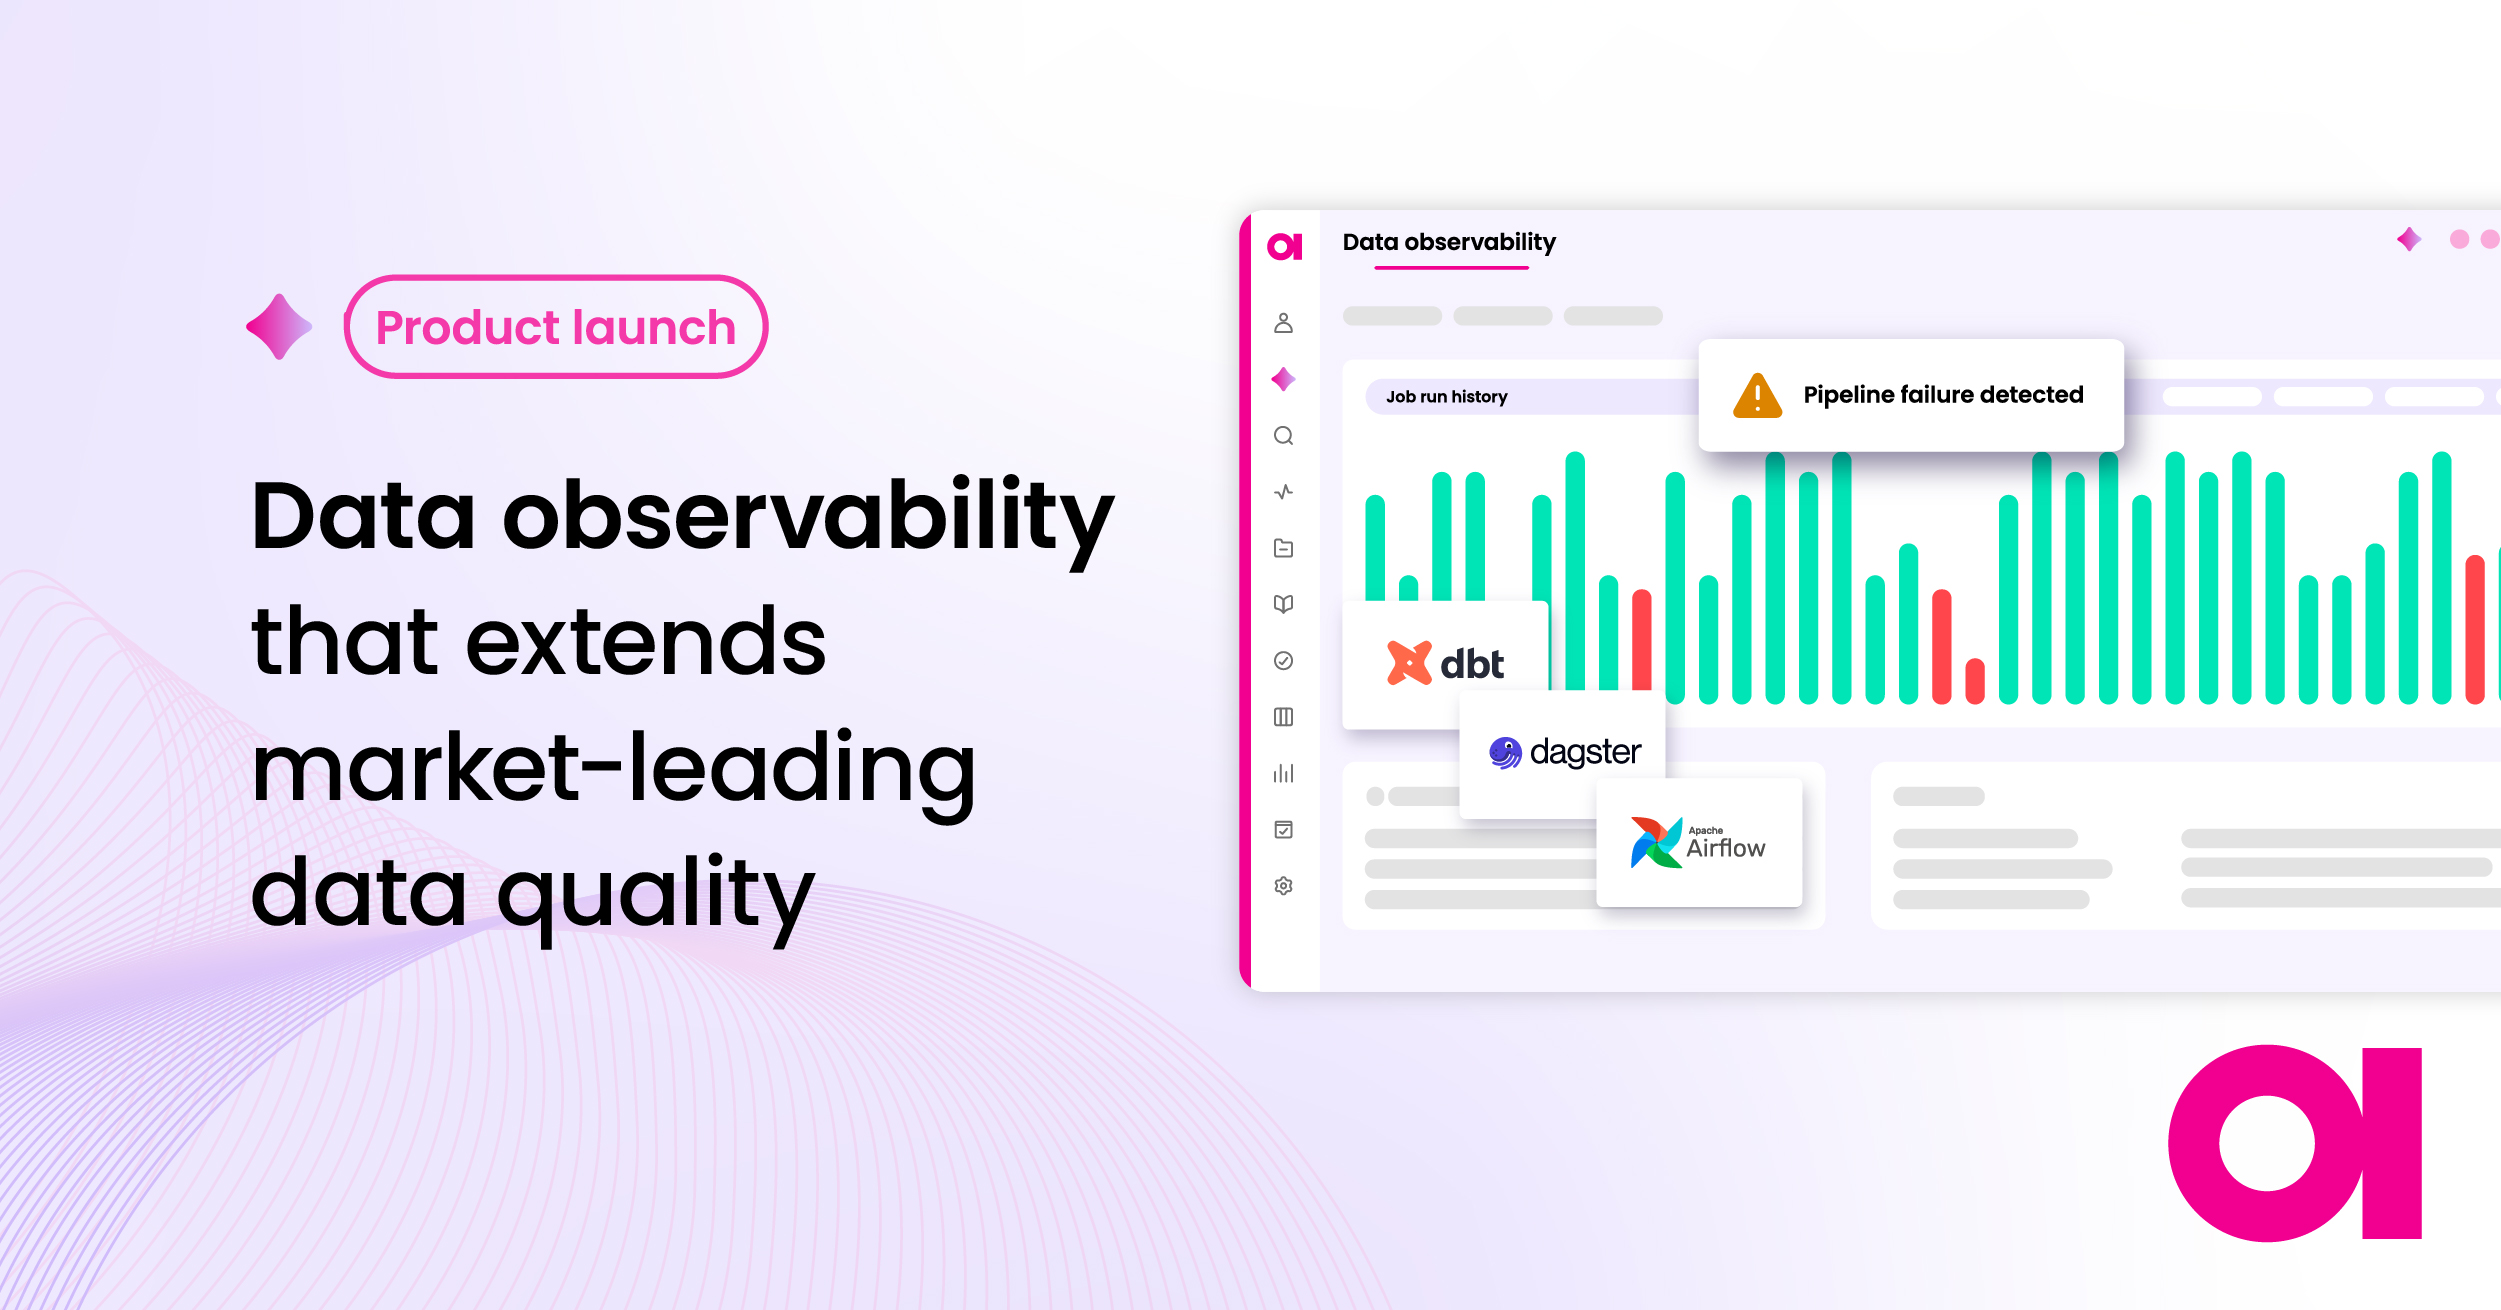
One of the most comprehensive proactive data management tools is data observability. It automates the entire data monitoring process, providing immediate updates and alerts as soon as something looks awry in your data stack.
But how different is it dealing with data issues with and without observability? This article will describe a data observability workflow, illustrating how much easier it is to deal with data quality issues once you have this tool in place. Let’s get started.
1. Receiving alerts
Data observability tools prevent issues from reaching downstream systems by providing alerts automatically. Once a significant change in your data is detected, the tool will alert the relevant parties and flag the table as potentially problematic.
For example: You receive an alert from an HR system regarding the “ATA Headcount” table – data validity has dropped by 60%.

2. Investigating the issue: source-level information
After receiving an alert, you’ll need to extract further information from where the data is stored (for example, a data warehouse or data lake). Using only the catalog will provide an overview of the data stored (i.e., catalog items, views, tables, DB locations, schema).
However, to find information about the problem, you must turn to the data observability functionality. You’ll immediately see the number of issues detected within this dataset. A data observability tool will identify problems using:
- Anomaly detection. Using previous data to notice when new data falls out of the typical pattern.
- Schema changes. An alteration made to a collection of logical structures.
- Validity. Comparing data against business terms/rules to test if it is valid.
- Record volume. Identifying unexpected changes in the number of records in a dataset.
Scrolling down further will show you catalog items listed from this data source. Here, you’ll find subsets of data from this source and can select the one that applies to your problem. You’ll also see a column labeled “issue type” which will tell you what type of problem the set is facing.
For example: Looking at our “Snowflake HR” system, we see that three issues have been detected. We see that data quality is at 75%. “Validity” and “anomalies” are ok, but “record volume” has “1 anomalous catalog item.”

Scrolling down, we see this issue is coming from the “ATA_HEADCOUNT.” dataset. The issue type is under the “record volume” tab.

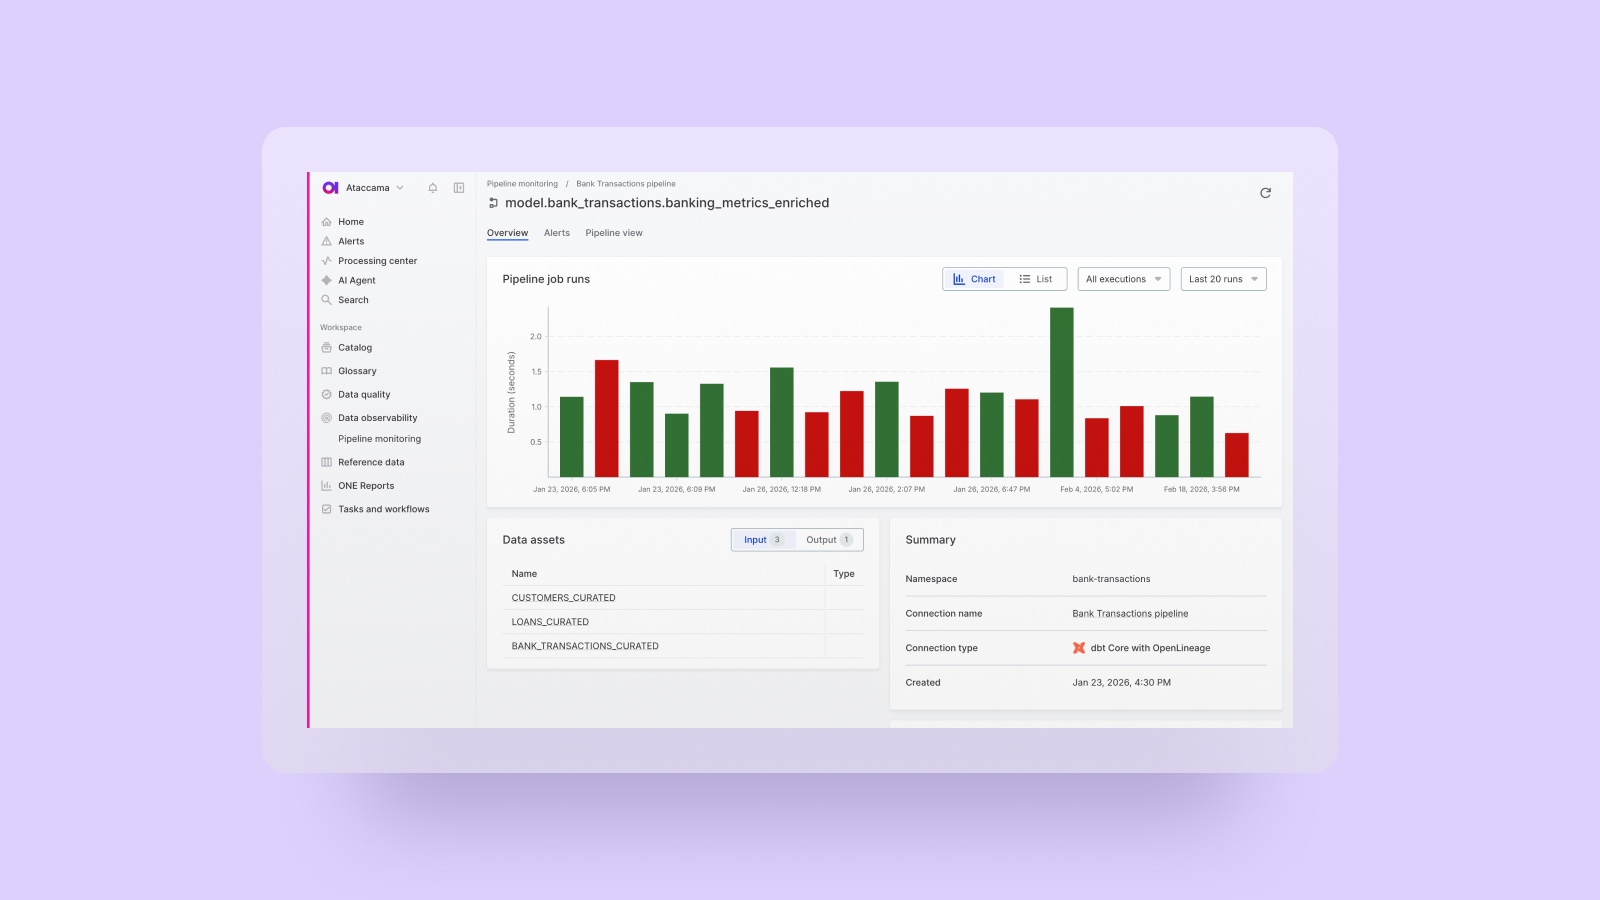
3. Investigating the issue: table-level information
Once we’ve explored the issue on the source level, we can take a look at the affected tables. There is information about the data’s structure, lineage, quality, relationships, and more. You’ll also see data quality information for every column of data assigned to the term in that source system.
One of the most valuable tools here is the graph of the anomaly. It visualizes your typical values against the potentially anomalous ones. This will help you assess the problem and decide if it’s a real issue or not.
You’ll then be prompted with the question, “is this an anomaly?” Answering it will help the observability tool to spot anomalies like this in the future or teach it to ignore them as expected values.
For example: The observability tool detects an unexpected number of null values and frequency of specific values in a data set. You can investigate further to decide if this is indeed an anomaly. Anomaly detection algorithms will learn from your decision and continue to flag events like this in the future.

4. Understanding the issue lineage
Now we understand the issue better, we need to find out what caused it. You can get that information from data lineage.
Data lineage will show you the source system and every step the data has taken on its journey, so you can look for where the drop in quality occurred. This will help you identify if the issue was caused by a data transfer or a miscommunication between systems.

IMPORTANT: Without lineage, you must manually find the problem in the database. If there was a broken pipeline, you might not have a chance to find the problem at all. However, data lineage is not a complete solution. Without other data observability metrics, a lineage tool will only tell you where the data came from. It will not identify or track issues in the data or data quality.
5. Contacting data owners and stewards
If you still need help finding the cause, a data observability solution with good metadata management capabilities also provides information on data owners, stewards, experts, and analysts for data sets. These individuals could shed some light on the source of the problem, but it will also inform you who to alert (the data producer and consumer) that something is wrong. This way, data producers can help fix the data, and data consumers can stop using it until it is fixed.
You can notify them about the problem through a “comment” or a “task.”

How to set up data observability on a new source system
All of this is useful if you already have observability set up, but what if you’re starting from square one?
Setting up observability on a new source system is easy as a few clicks. Instead of data producers needing to set up DQ for tables individually, you have a one-size-fits-all solution to monitoring data quality.
Once you have it set up, you will receive reports on data as often as you need. Discover problems while they’re still fixable, not just to play clean-up.
All you have to do is:
- Open up your source system.

- Use the “configuration” dashboard.

- Select terms you want the tool to monitor.

- Choose how often you want to monitor (daily, weekly, monthly, real-time).

- Decide where you want your notification sent (e-mail, in-app, Slack).

It’s that easy!
Get started with data observability
While this is one workflow for observability, it’s certainly not the only one. Data observability tools are versatile. They can adapt to your specific use case. By the time bad data reaches your reports, it’s already too late! Stop data issues in their tracks.
At Ataccama, we’ve built the most comprehensive, no-code data observability solution that requires minimal configuration and easily scales with your data landscape. Learn more here.