The Gartner Magic Quadrant for Data Quality: understanding, criteria, and insights

If you’re reading this, you’re already aware of data’s importance and its impact on business and the world as we know it. With such significance, it should come as no surprise that the data and data quality markets are packed with competitive solutions and tools for harnessing this valuable resource.
That’s why Gartner created the Magic Quadrant for Augmented Data Quality Solutions, a report ranking the top data quality solutions available to data-driven businesses. It measures the advantages and disadvantages, providing a data quality tools comparison that takes into account the scope, capability, efficiency, and, this year, how each solution utilizes automation.
Below, we’ll explain how Gartner chooses data quality tools to land in the magic quadrant and what insights they reveal about the data quality industry as a whole. Let’s get started.
The state of data quality – according to Gartner
Of course, data quality is all about improving the state of an organization’s data to reduce time to industry insights and drive better decision-making. In its raw state, data often fails to meet its full potential. Data quality tools with AI allow for the improvement and better understanding of these assets so companies can maximize their benefits.
Having reviewed countless data quality solutions and businesses, Gartner’s Magic Quadrant compares them based on their ability to “enhance the data quality experience” of an organization. This can come through several processes, such as:
- Improving insight discovery
- Next-best-action suggestions
- Automation via AI/machine learning
- Graph analysis
- Metadata analytics
They describe that these technologies can work independently or codependently, establishing an interconnected network of multiple tools aimed at a seamless approach to maintaining data quality.
How does Gartner determine the magic quadrant for data quality solutions?
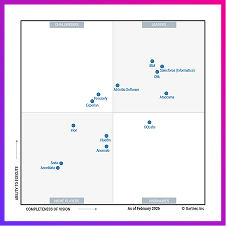
So, what is Gartner’s magic quadrant? Gartner magic quadrants are represented via a graph divided into four sections (quadrants). The Y-axis measures the “ability to execute,” while the X-axis measures the “completeness of vision.” Based on your results in these categories, you will land in one of four quadrants: Nich players, challengers, visionaries, and, the most “magic” of the quadrants, leaders.
You can find a more explicit definition of the magic quadrant and what each quadrant means below:

Here is this year’s Gartner Magic Quadrant for Augmented Data Quality:
As you can see, companies that land in the “leader” quadrant come with the highest recommendation from Gartner, marrying their adept ability to execute with a complete vision of the present and the future.
Gartner’s essential capabilities for augmented data quality solutions
We already mentioned the Gartner Quadrants’ emphasis on augmented data quality this year. They believe data quality solutions that provide advanced techniques that streamline manual processes and expand user accessibility are the future and mainstay of the industry.
For example, you can consider Anomaly Detection. A data quality solution that employs anomaly detection can scan for patterns in incoming and stored data, assessing new and existing data against norms and identifying outliers. This can allow data scientists to spot errors and inconsistencies in data they might otherwise have missed.
However, augmentation is just one aspect of the ideal data quality solution. Gartner data quality comes down to multiple essential capabilities. The data quality tools Gartner recommends include:
- Ability to integrate with diverse data sources
- Adept profiling, empowering business user insights in DQ issues
- Engaging and interactive visualizations and analytics
- Ability to monitor DQ issues and discover trends
- Monitoring based on predefined or adaptive DQ rules
- Automatic recognition of anomalies, drifts, patterns, and outliers
- Ability to complete basic DQ tasks:
- Matching, linking, merging, curation, enrichment, standardization, parsing, cleansing
- Metadata discovery, lineage, and root cause analysis
- Support for multiple domains
- Data quality rule management and validation
- Clearly defined business process and issue resolution workflows
- Supporting and improving communication, integration, and automation (between data managers and consumers) via DataOps
- On-premise, cloud, and hybrid deployment options
- Reliable architecture and integration
- Universal usability and accessibility for priority roles at the company (especially non-technical users)
Gartner’s inclusion criteria for the magic quadrant for augmented data quality solutions
So, what must a data quality company do to get into the Gartner data quality magic quadrant? It all boils down to Gartner’s inclusion criteria for creating data magic. The company must:
- Have a stand-alone data quality solution.
- Provide critical data quality functions.
- Support the automation of critical data quality functions.
- Be capable of large-scale deployment and support for cloud-based/SaaS versions.
- Be functional on multiple, diverse data domains.
- Maintain a base of at least 100 production-paying customers valued at over $5 million.
- Serve companies in multiple countries.
- Cater to four or more of the following user types: data stewards, architects, quality analysts, integration analysts, scientists, business intelligence, and casual users.
- Offer out-of-box and prebuilt DQ rules.
- Be integrative and interoperable.
- Offer direct sales and support options in at least two of the following regions: North America, South America, EMEA, and Asia/Pacific.
Gartner’s ranking criteria for augmented data quality solutions
Now that we know how to get into the magic quadrant, what separates a leader from a challenger? Or a niche player from a visionary? Gartner uses the following criteria to rank its data quality magic quadrant candidates, ranked from the highest priority to the lowest:
- How well does the solution fit the current market needs?
- How well does the sales channel function?
- I.e., pricing, negotiation, presale support, and overall effectiveness
- What is the customer experience and satisfaction level?
- How likely is the vendor to continue their investments and product offering?
- How well/quickly can the vendor respond to shifts in the market, capitalize on opportunities, adapt, and evolve?
- Can this vendor provide messaging that influences the market? What is their ability to increase brand awareness and improve their image?
- What is the quality of the organization’s structure, the skills and experience, and the stability of key staff?
Hearing from an industry leader on Gartner Magic Quadrant for Augmented Data Quality
At Ataccama, we’re proud to be a member of Gartner’s top tier for augmented data quality solutions. Our CEO, Mike Mckee, had this to say about the special honor:
If you missed it at the beginning, you can download the entire Gartner Magic Quadrant for Augmented Data Quality report here. We hope you find it helpful and look forward to being a major player in the data quality industry for years to come!
Curious about Ataccama data quality? Check out our platform page.