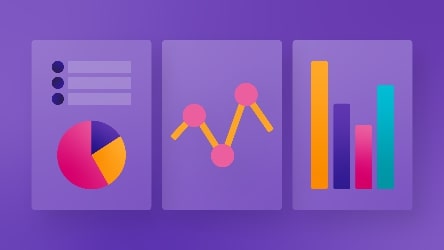
Visualize and analyze data from multiple sources
Add explainers and connect the dots for your audience
Create a data story out of multiple visualizations
Share a link to your story or embed it on a webpage
Why Data Stories
Data Stories combines the best parts of data visualization, storytelling, and reporting from presentation tools like PowerPoint and reporting tools like PowerBI and Tableau.
BI dashboards can be overwhelming
Data Stories present facts and statistics gradually and let you use various charts and explainers to drive a point home.
Slide decks don’t stay up to date
Data Stories can connect to a live data set and update the story along with the data. You don’t have to copy and paste new charts for each new report.
Data visualization tools don’t let you tell a story
Data Stories lets you connect multiple data sets, analyze data, and create a storyboard where you can explain your insights.
Visualize and analyze data
- Upload a flat file, provide a URL to a live data set, or connect to Google Drive.
- Use Data Explorer to prepare your data
- Come up with a narrative.
Connect the dots for your audience
- Add textual explainers
- Generate insights
- Describe your data with a story
Refine your story and enhance reports
- Add boards to gradually unveil facts
- Use steps within boards to explains insights
- Add filters and drilldowns
Share your story
- Generate a link to your story and easily share it with others
- Set expiry dates
- Embed stories into any web page
Keep your audience engaged
- Viewers can read the story at their own pace
- Viewers can interact with stories and drill down into details that interest them
Data Stories is part of the Ataccama ONE platform
Use any data and metadata from Ataccama ONE and do custom analysis.
Build a report catalog
Data exploration and reporting built into Ataccama ONE
- Import data sets via the Data Catalog or ONE Data.
- Build reports based on trusted data
- Publish reports to the Data Catalog and share with everyone
Create custom data quality analysis and reporting
Import data quality monitoring results and create custom reports and data stories
- Seamlessly import data quality monitoring results
- Create different views to identify data quality trends and outliers
- Build custom reports that can be easily shared with other stakeholders
Power
data democratization
Create a culture of communication
Give everyone a means to share insights within their team or company-wide.
Simplify reporting workflows
Save time creating reports. With stories, reports stay up to date when data changes.
Make information readily available
Create easy-to-consume reports that stay up-to-date and effortlessly onboard new employees.
Data playground
Access data through our data catalog and get insights from the data set without external help.
Interested in Data Stories for the enterprise?
Features that will help you tell and share your data stories
Cross-filtering and drill-downs
Compare data in real time by filtering and interacting with charts in the same view.
Animated steps
Create animated transitions between charts to highlight specific data or explain what’s shown on the chart.
Share stories with ease
Effortlessly share stories via a link with anyone inside or outside your organization.
Custom explainers
Add comments and explainers to your stories, or let the AI do it for you.
Automated data updates
Set up recurring synchronization so that your stories stay up-to-date.
Time machine
Leverage dynamic animations to show how information evolves over time.
All the visualizations
you need
Change over time
Bar chart
Line chart
Heat map
Correlation
Scatter chart
Bubble chart
Heat map
Part-to-whole
Pie chart
Doughnut chart
Bar chart
Magnitude
Category chart
Bubble chart
Bar chart
Distribution
Histogram selection
Histogram chart
Ranking
Category chart
Bar chart
Spatial
Country map
Scatter map
Useful widgets
Heading
Table
Image
YouTube video
Learn data storytelling
best practices
Top 10 Takeaways from WSJ Guide to Information Graphics
A summary of the best advice in the Wall Street Journal Guide to…
Read more5 Common Problems with Enterprise Reporting
Learn about common problems in Enterprise reporting so your company can build…
Read moreHow to tell a story with data: 5 Steps to make it work
Understand how to tell a story with data successfully using our 5 proven steps…
Read moreData Quality Storytelling: A Better Way to Do DQ Reporting
Liven up your DQ reports with the latest data visualization technology.
Read moreWhat is a report catalog?
Learn about report catalogs, a singular point of access for your company's…
Read more Discover the Ataccama
ONE Platform
Ataccama ONE is a full stack data management platform.
See what else you can do.